How independent Tracee Hutchison overtook One Nation to finish second in the Nepean by-election
The Victorian Electoral Commission has today finalised the count in the by-election for Nepean, on the Mornington Peninsula.
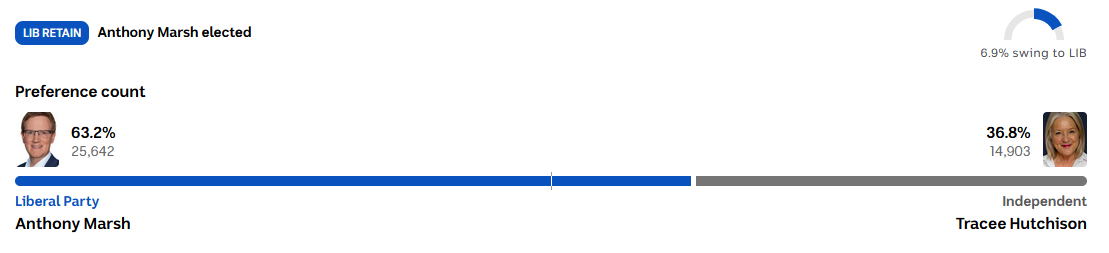
It confirms Anthony Marsh's final margin of victory at 13.2 per cent, a 6.9 per cent swing toward the Liberal Party. Final figures are available at the ABC News website.
While it was obvious on election night that Marsh had won the seat, it was slightly less clear who had come second. Both independent Tracee Hutchison and One Nation's Darren Hercus secured a primary vote above 20 per cent.
It was an interesting example of the squeeze the Liberal Party is under from strongly performing candidates on both flanks. In this case, the Liberals were far enough ahead on first preferences, and would've gone on to win no matter who ended up in second place (compare that to the federal by-election in Farrer, where we saw the Liberals pushed deep into third place, where they'll be excluded before being able to receive preferences from either flank).
The electoral commission counted preferences between Marsh and independent Tracee Hutchison on the night, and it seemed likely that would be the final pairing, but Hutchison needed to overtake One Nation's Darren Hercus who ended up second on the first preference vote.
The final distribution of preferences confirms that she did manage that, and shows how it happened.
One Nation gained on Hutchison by about 0.4 percentage points after the exclusion of the Libertarian and Reform AU candidates.
It was the exclusion of the Greens that was decisive: Hutchison received 70.1 per cent of the votes transferred at that stage of the count, and just 9.2 per cent went to One Nation. That was enough to see Hutchison end up more than 3 percentage points ahead of One Nation at the final exclusion. In the end it was a relatively comfortable second place finish.
You can explore the full distribution of preferences here (table looks better on desktop, apologies)
When One Nation was excluded, 77.5 per cent of the preferences went to the Liberal Party.
I'm yet to complete a full analysis of One Nation preference flows in South Australia's state election but that flow looks to be similar or a bit stronger than we saw in many SA seats (noting that there were more seats where the Liberal was excluded in SA than ones where One Nation was excluded, and One Nation's preferences were mainly distributed in the inner metropolitan area so may not be fully representative)
No spam, no sharing to third party. Only you and me.
Member discussion